Mithril: An
Experiment in Adaptive Security
NCSA Security Research
Abstract
This
is detailed account of our experiences and accomplishments in our attempt to deploy
and manage an adaptive security system. Our system consists of an intrusion
detection system (IDS), an attack correlation layer and a response layer which
reacts to specific attacks as well as enforcing an adaptive system policy. We
studied various implementations and found that the open source Prelude Hybrid
IDS would best fit our needs. Prelude uses both network and host-based,
heterogeneous distributed sensors to generate alerts. Its reporting protocol is
Intrusion Detection Message Exchange Format (IDMEF). It currently uses Snort as
its primary network sensor and its own Prelude LML (Log Monitoring Lackey) as
its primary host-based sensor. It supports a variety of other sensor types by
linking them into the Libprelude communication layer. Essentially the library
enables a sensor to convert its native alert format to IDMEF and allows a
secure communication path to a Prelude Manager. Once an alert is generated by a
sensor, it is sent to a Prelude Manager where it is loaded into the Prelude
database. The front-end to this database is the web-based management console
Prewikka. We modified Prewikka to incorporate and allow the enforcement of our
system policy settings. The Prelude team provided a mechanism for correlating
alerts using the standard Simple Event Correlator (SEC). Our response
mechanisms for enforcement are script-based. We created Perl scripts for
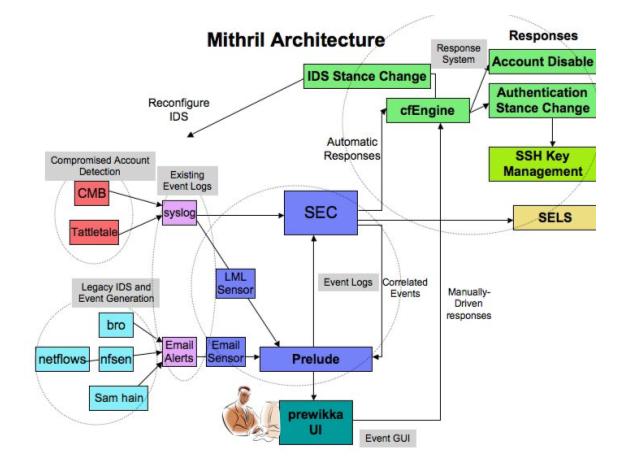
reacting to specific attacks and Cfengine for system-wide modifications. Here
is a good general diagram of the overall framework for Mithril.
Prelude
Hybrid IDS
The
Prelude Hybrid IDS was chosen because it offered the most flexibility due to
being both open source and compliant with a variety of existing sensor models.
This allowed us to gather a variety of generated alerts from various sources
and analyzing them in a centralized system. Not being committed to a specific
IDS type, we effectively implemented the hybrid IDS as our general system for
gathering data and correlating events. Here is a non-exhaustive list of the
strengths. Since it is a hybrid system it is flexible and highly adaptive.
Being open source, the code can be modified easily to fit our needs. Prelude is
generally cross-platform except for Win32, which is in progress. It employs
flexible IDS rules so that it ‘understands’ and readily incorporates third
party rules. It is a hidden IDS in that it is not attached to an IP. It uses
the standard IDMEF protocol for alert specifications. And finally, it supports
a large number of existent IDS’s including Snort, Honeyd, Nessus VS, Samhain
and LibSafe. When we first installed and configured Prelude, we used version
.8. We later upgraded to version .9 as significant improvements and
capabilities were added. Minimally, version .8 uses the communication library
Libprelude, the Prelude database, Prelude Manager, PreludeLML, Prelude NIDS and
the web-based console Piwi. Version .9 uses the communication library
Libprelude, the Prelude and Prewikka databases, Prelude Manager, PreludeLML,
Snort and the web-based console Prewikka. Other types of sensors are available
for both versions, but we decided that this minimal configuration would serve
our needs without adding further complications. We used the available Debian
packages since our test platform is Debian GNU/Linux. Here is an overview of the basic Prelude
components.
Libprelude
is the foundation of Prelude IDS system. It is a C library that enables all of
the Prelude components to communicate via SSL connections using the IDMEF
protocol. These connections are created after the installation of a sensor
using a utility called ‘prelude-adduser’. In version .8 the utility is called
‘sensor-adduser’, but the functionality is identical. Generally, there is a
handshaking password exchange between the sensor and the manager. Specific
details will be covered when we discuss the installation of a sensor.
Libprelude also provides the ability for third-party software to link with it
making them ‘Prelude Aware’. That is, they can communicate with Prelude
components using IDMEF. This is typically used when building a sensor which is
hooked into the Prelude IDS. A sensor can be built using C, Perl or Python. We
will look at the specific details for coding a sensor in the ‘Installing and
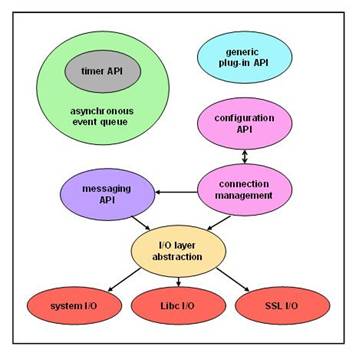
Building Sensors’ section. Basically, the required steps include initializing
Libprelude, creating a Prelude ‘client’ which enables interaction with the
library and finally destroying the client. Here is a diagram of the general
layout of the library culled from Prelude documentation.
The
Prelude database is the repository for all of the data gathered within the
Prelude IDS framework. Primarily it contains all of the alert information
including timestamps, source/target IP, users, severity, etc. The database also
includes Prelude user settings and agent data such as heartbeats,
configurations and locations. The Prewikka database added with version .9
provides tables for specific needs of Prewikka. Database reporting support
includes MySQL, PostgreSQL and Oracle. We used MySQL. The database tables for
both versions can be found here.
Prelude
Database Tables - 0..8*
Prelude Database Tables - 0.9*
The Prelude Manager is the component which recieves
all of the alerts from the sensors. It provides centralized management for a
highly distributed system. It also enables scalability and survivablity by
being distributable itself. That is, many Prelude Managers can coexist on a
single system sending data to a centralized database. This allows sensors to
report to Managers which in turn report to other Managers by forwarding the
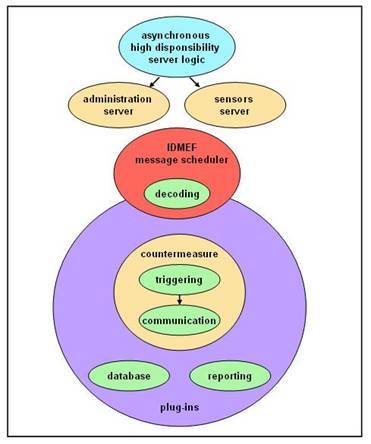
alert data. This partitioned architecture maximizes
coverage with centralized analysis while preventing entire system failure due
to a successful compromise. There is also a built-in capability for communictaion
with counter-measure agents. Here is the general architecture of the Prelude
Manager culled from Prelude documentation.
Prelude LML (Log Monitoring
Lackey) is the log file analyzer which acts as a host-based sensor. It does
this by watching specified log files, typically syslog, auth.log and messages,
and uses PCRE (Perl Compatible Regular Expressions) rules to match lines in the
file. Once there is a match, an alert is created and sent to its Prelude
Manager via SSL tunnels. It normalizes the data preventing multiple entries for
a single alert. Prior to transmission, the alert data is transformed into IDMEF
in Libprelude. More information is available on
Prelude-LML: Overview/PCRE.
In version .8, the primary network-based sensor was Prelude NIDS. But since by design it implemented Snort rules, it was deprecated for version 9 and Snort itself is used. Because of this, we needed to build a compatible version of Snort (2.4.5) linking it with Libprelude. We will look at this specifically in our discussion of the Snort-Prelude sensor. The NIDS sensor is responsible for real-time network packet sniffing and analysis. To capture network packets, it uses a modified version of Pcap. The sensor decodes the packet headers and stores them internally. Then it performs various validity tests which detect any malformed data. More sanity checks are done on the IP and TCP flags. If an anomaly is detected, the packet is rejected. After these tests come IP defragmentation and TCP reassembly operations. Finally packet data is analyzed by Snort using signature, protocol and anomaly based inspection methods. In the earlier version, Prelude NIDS analyzed the packets using various plug-ins. With version .9, Snort is used exclusively.
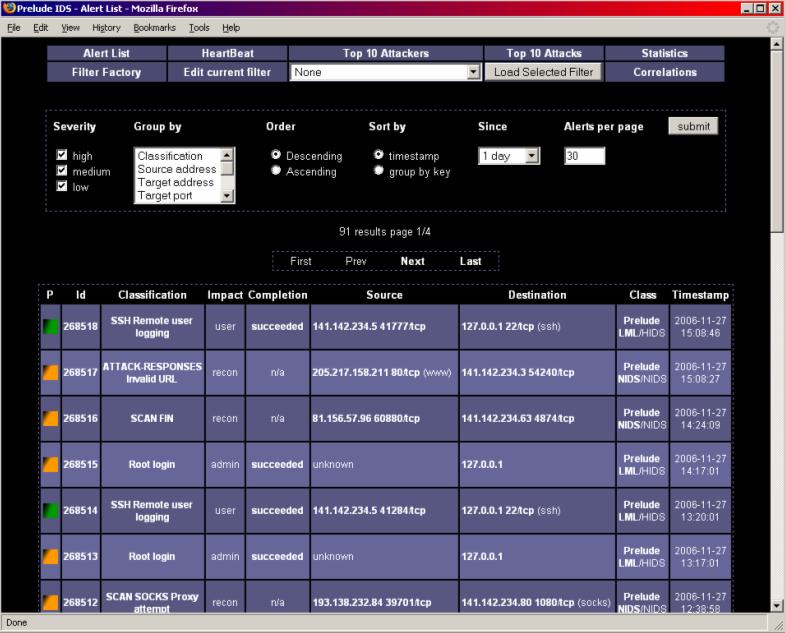
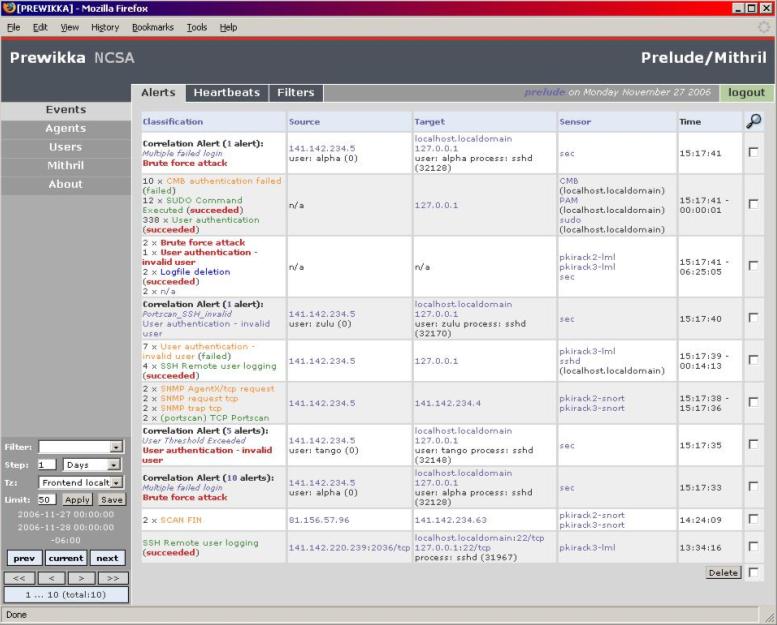
Finally, let’s take a look at
the web-based console. In version .8, Prelude used a Perl implementation called
Piwi. In version .9, a Python interface is called Prewikka is used. Basically,
the views allow the user to monitor alerts as they are received, filter those
alerts so they can be aggregated and view appropriate graphics for analysis. We
needed to make modifications with each version so that we could correlate
alerts and activate appropriate attack responses and enforce system policy
changes. Her are views of each version. The first is the alerts view for Piwi
and the second is the alerts view for Prewikka.
Alerts and
IDMEF
Obviously,
alerts provide the groundwork for any effective IDS and ultimately determine
the reliability of a reactive system. At the base level, we need to determine
whether we are getting the alerts that we need. The Prelude sensor rules are
very comprehensive. In fact, at times we needed to modify configuration files
so that we would not generate alerts that were generally meaningless to us. One
specific instance was a Snort alert called ’BAD-TRAFFIC IP Proto 103 PIM’ which
generated an excessive number of alerts. The alerts were being triggered by a
harmless routine anomaly caused by Cisco routers. We filtered out the alert by
commenting out the appropriate line in the rules file ‘bad-traffic.rules’ and
restarted Snort loading the modified rules. We did this for a number of
extraneous alerts as well. Also, the IDS is only as effective as its rules, so
updating the rules on a regular basis strengthens the detection process. NIDS
rules updates are available for Snort on its website and updates for LML are
always up on the Prelude site. In fact, most of the alert ‘trimming’ that we
did was in the LML rules which monitor log files.
An
alert is the outcome of an event that is triggered by the occurrence of an
anomaly that is being looked for. When we refer to an ‘alert’, technically it
means a standardized representation of an event in IDMEF. So the role of the
sensor is to convert the event into an XML-based IDMEF alert. The Prelude
Manager receives these notifications and takes the alert structure and loads it
into the database as tables. Through the web console, Prelude allows the user
to view the alerts in a easily readable format as HTML table rows or in raw
XML. Here is the entire ‘alert’ namespace for IDMEF used by
Prelude.
Let’s look at two of our implementations for
generating alerts. One is the Tattletale daemon which detects instances of root
privilege escalation. The other is Continuous Mouse Biometric (CMB) alerts
which detect when an unauthorized user is attempting to use a particular
machine. Both detectors enter data into a log file when an event is
encountered. Tattletale uses ‘syslog’ and CMB uses ‘messages’. Prelude LML monitors these log file by using
PCRE configured in ‘pcre.rules’ which further breaks down the regex tests in
specific rules files. Inside ‘pcre.rules’ we find the following lines that tell
the PCRE engine when it finds a regex matching ‘ttd’ or ‘CMB’, look further
into more specific rules files.
regex=ttd; include = ttd.rules;
regex=CMB;
include = cmb.rules;
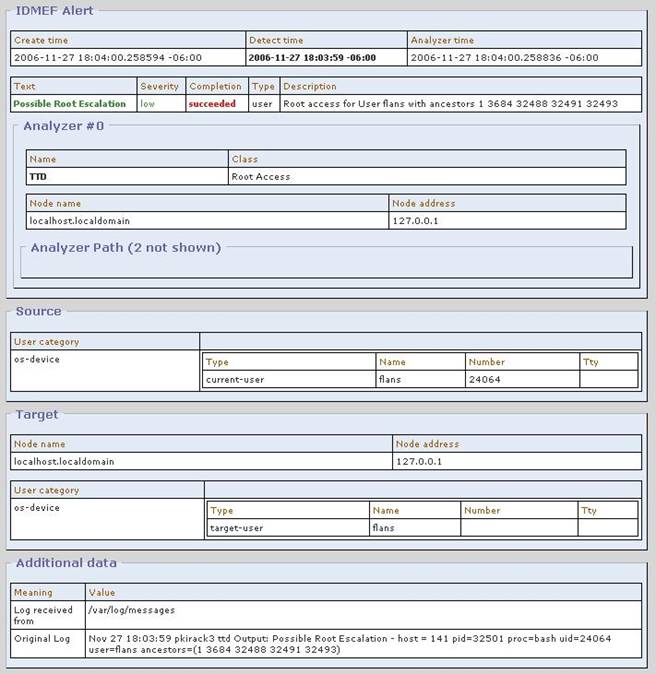
Here is ‘ttd.rules’ with an example line that will
match in the log file. The CMB detection alert is very similar.
# Sep 19 09:58:55 pkirack3 ttd Output: Possible Root
Escalation - host = pkirack3 pid=21319 proc=bash uid=24064 user=flans
ancestors=(1 3709 21306 21309 213 11)
regex=Possible Root Escalation - host = ([^ ]+)
pid=(\d+) proc=([^ ]+) uid=(\d+) user=([^ ]+) ancestors=\(((\d+\s?)+)\); \
classification.text=Possible Root Escalation; \
id=1; \
analyzer(0).name=TTD; \
analyzer(0).class=Root Access; \
assessment.impact.completion=succeeded; \
assessment.impact.type=user; \
assessment.impact.severity=low; \
assessment.impact.description=Root access for User
$5 with ancestors $6; \
source(0).user.category=os-device; \
source(0).user.user_id(0).type=current-user; \
source(0).user.user_id(0).name=$5; \
source(0).user.user_id(0).number=$4; \
target(0).user.category=os-device; \
target(0).user.user_id(0).type=target-user; \
target(0).user.user_id(0).name=$5; \
last
A regex match will generate an IDMEF alert with text
‘Possible Root Escalation’ along with other useful alert parameters. Here is how the TTD alert ultimately appears in Prewikka.
Installing
and Building Sensors
Installing
and configuring the sensors turned out to be a bit tricky. Through trial and
error we eventually got it right. Obviously, the component versions needed to be compatible and it was not always
clear. We found a distribution for version .9 and stayed with it. The detailed
steps for installation and configuration and package information for Snort and
Prelude LML are in Sensor Installation.
Basically, there are a lot of dependencies which creates a lot of compatibility
problems. But once that is resolved, configuration and initialization are
fairly straightforward. We had to build Snort with Prelude support because the
version we need was not a Debian package. We will discuss this after an
overview of the basic process.
- install the sensor noting dependencies
- run adduser for the sensor and manager to
set up the sensor-manager SSL connection
- edit the appropriate configuration file to
set the manager address
- start up the sensor with parameters –
create scripts appropriately for restart upon rebooting
for example, with script… /etc/init.d/prelude-lml start
and without script… snort -D -c
/usr/share/prelude/sensor-dist/snort-2.4.5/etc/rules/snort.conf -i eth0
- check
prewikka on the prelude manager to make sure that the sensor shows up and is
online.
Now
we should take a quick look at sensor creation from scratch. As said before, a
Prelude sensor can be built using C, Perl or Python. The key is building a
Prelude client object which is the
interface with Libprelude. We created a simple sensor using C using the
following code. This is a great example
of how straightforward developing for the Prelude API is. Building
a Prelude Sensor using C, Perl or Python. Here are the basic steps for all
three methods.
-
initialize the Prelude library
- create the prelude_client_t - start the client - initialize manager connection
-
send the initial heartbeat
- initialize the heartbeat timer flags - use the low or high level API
-
the low level API is faster and more optimized - but more error prone
- sending the actual IDMEF message - destroy the client
Attack
Correlations
Attack
correlation became a central issue in our research. We found that in order to
react to an attack effectively, one needs to have more than just alerts.
Usually effective attacks are preceded by an orchestrated pattern of some sort
that can be difficult to identify. The strength of using a hybrid IDS really
became apparent at this point because we had alert data from network and
host-based sensors giving us a clearer view of what might be happening. Often
one or the other is just not enough information. But we still had the
difficulty of deciding what we needed to look for, whether we were getting the
crucial alerts and in general sorting through many attack patterns and schemes.
This was even further complicated by actual implementation. At time we started
working on Mithril, Prelude had no ability to perform correlations. With our
first pass we decided to do some simple correlations based on alert types and
time intervals. This allowed us to detect basic scanning attacks and brute
force attempts on an SSH account. The brute force attack could detected by
setting a threshold rate of alert generation. This was performed by using
Prelude alert filters and applying the appropriate time interval for the
database query. The source IP was set as a query parameter as well. This was
done our implementation of Prelude version .8. Here is a diagram that shows how
we modified the Piwi interface to indicate the attack. Our system policy
response screen is also displayed. At this point we did not have an automated response
for specific attacks in place.
With
version .9, Prelude provided a way of performing correlations using the
standard SEC (Simple Event
Correlator). It was developed as an initial attempt to provide correlation for
Prelude. For future versions, the Prelude team plans to provide built-in
correlation tools integrated directly into the Prelude Manager. But in the
meantime, using SEC provided us with a very effective and straightforward means
to perform correlations. Its design is very similar to that of Prelude LML. The
PCRE engine loads rulesets that perform regex comparisons on input streams. In
order to make Prelude work with SEC, all of the generated alerts were
intercepted from the Prelude Manager as IDMEF and the Prelude team built a
conversion module for SEC that allowed it to scan IDMEF as its input. Prelude
provided some simple rulesets, but we developed a few more to suit or needs.
Here are some of the basics. The SEC engine is a Perl script which uses a file
stream as input and loads rulesets at runtime
|
type |
rule type (9 supported ) |
|
ptype |
pattern type (13 supported
/ customizable) |
|
pattern |
rule triggering pattern |
|
context |
identifying name of the
correlation |
|
continue |
exit at this rule or
continue to next |
|
desc |
event description |
|
action |
action list upon success |
|
thresh |
threshold number |
|
window |
time window in seconds |
|
time |
for Calendar type |
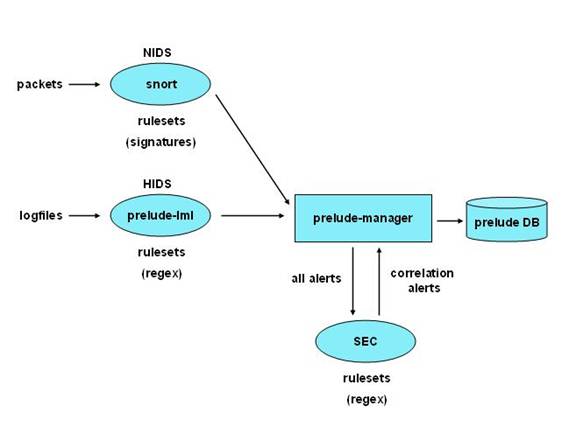
Here
is a useful diagram that shows how Prelude and SEC are integrated. It also
indicates how similar the roles of SEC and Prelude LML are in terms of scanning
input data for pattern matching. On the left, we see the sensor inputs for the
NIDS and the HIDS. All of the alerts are fed into the Prelude Manager where
they are loaded into the database and also sent to SEC. In actuality, SEC is
acting as a sensor as well. Where the input data for Snort and Prelude LML are
packets and logfiles respectively, all of the alerts as an IDMEF stream is the
input for SEC.
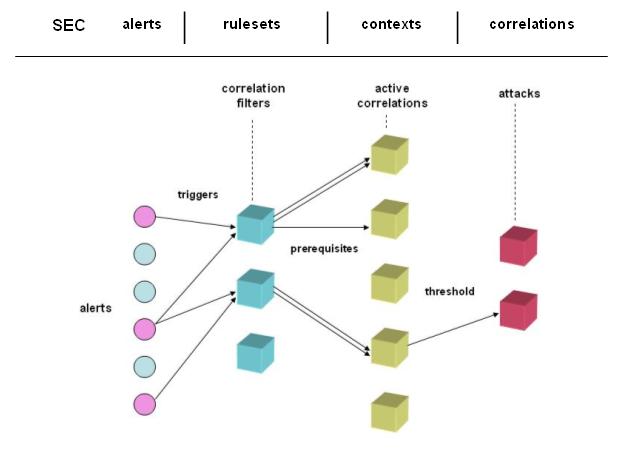
We
did some research on correlation techniques and theories and we came up with
some general guidelines about what we need to implement in order to get useful
information about attacks. This diagram of a typical attack graph was an early
attempt to determine what we needed in terms of correlations. Terminology was
often a source of confusion, so we agreed upon some common concepts. Alerts are
generated by the sensors. Correlation filters are essentially templates that
wait for alerts to trigger instantiations as active correlations. Once we have
an active correlation, further alerts that fit the correlation are
prerequisites until it matures either as an attack or eventually times out.
When a threshold is met - we have an actual attack. The names at the top show
the corresponding terminology of SEC.
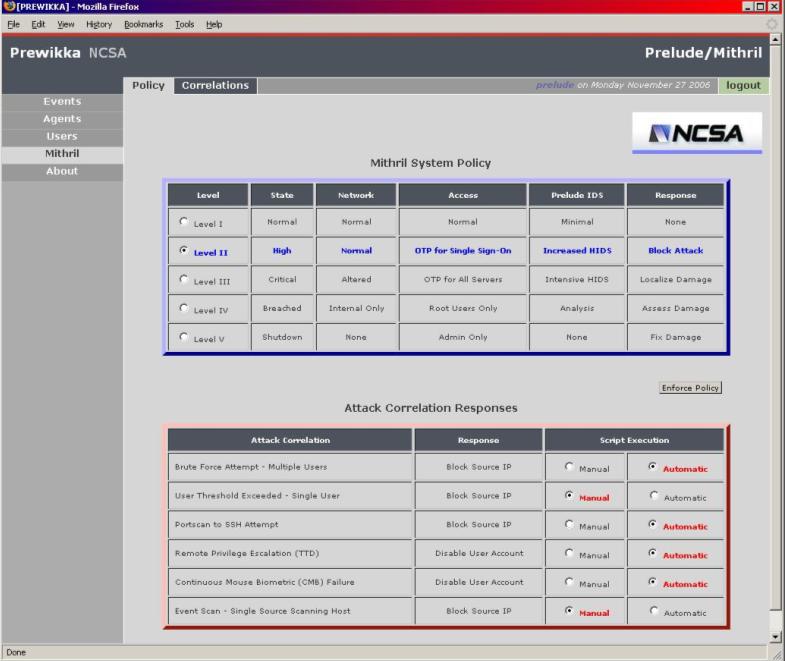
Prewikka
Modifications
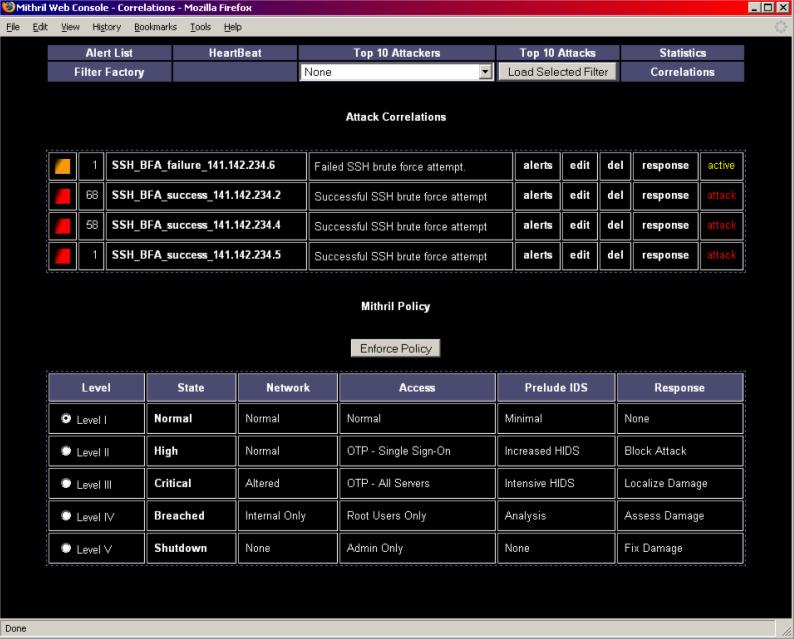
With
Prewikka and Prelude version .9, we had our correlations mechanism in place.
Once an SEC ruleset detects an actual attack, it creates a correlation alert and
feeds it back to the Prelude Manager which in turn loads it into the database.
The Prewikka alerts diagram shown earlier has a few examples of these
Correlation Alerts generated by SEC. This diagram shows the system response
table as well as the specific attack type responses. By changing the security
level and hitting ‘enforce’, a series of scripts are fired which alter
system-wide policy settings such as OTP for Single Sign-On and OTP for All
Servers. The lower table shows the response associations with specific types of
correlated attacks. We implemented six of them. The are brute force attempts on
an SSH logon, excessive single user activity, a portscan followed by an SSH
attempt from the same source IP address , root privilege escalation from a remote
IP address, a continuous mouse biometric failure and an event scan where there
is a single source IP scanning a host on the network. For each of these
correlations, we developed a ruleset file for SEC to load at startup. Details
about how this is done are on Building an
SEC Ruleset for Attack Correlations. The script execution parameter can be
set to manual or automatic and is set when the user hits ‘enforce’. These
values are stored on the server. When SEC detects an attack, its ‘action’ field
fires a script which checks the value before proceeding with a predetermined
response. If set to manual, it does nothing. If automatic, it carries out the
response. If manual, we can fire the response script manually from a drop-down
menu which is tied to the Correlation Alert in the Prewikka alerts view. In
this drop-down menu we also added inspection utilities such as ‘netstat’ and
‘nmap’ to complement the existing menu items ‘whois’ and ‘traceroute’. This was
done to enhance the first level of inspection abilities tied to specific
alerts. Details concerning the installation and configuration of Prewikka as
well as our file modifications can be found at
Prewikka Installation and Modifications.
Response
Mechanisms and Adaptive System Policy
Our
response framework is all script-based. For specific types of attacks, we used
Perl scripts to perform such tasks as altering IP tables. The system-wide
policy settings are enacted by the cfEngine
configuration engine. At this point, we
divided the adaptive system in five distinct levels of security as a proof of
concept. Each level that is selected and enforced fires a script on the server that
has preset parameters. This should be extended so that each level can be
fine-tuned for specific system needs. The table shows general assumptions about
what each level means, but its functionality can be greatly improved. In fact,
the interface configurations should be stored as an XML policy file so that
state can be maintained and modified. Each level should be linked to a
configuration web page so that an administrator can alter system security
settings efficiently.
One
result we wanted to accomplish was to provide a useful framework for our
security group. We met with them frequently in order to understand issues they
dealt with on a daily basis. They use the Bro IDS which detects events and
generates email messages as notifications. Then there is an inspection
performed on the appropriate log files to determine the nature of the event
that has occurred. This can be an extremely tedious process. The advantage of
having a web interface like Prewikka is that troublesome alerts can be seen as
they occur in one place where they can be visually correlated with other events
that may be related. The interface acts as a central management console. From
an IDS and forensic point of view, it serves as an entry point for the
inspection process. We added typical initial actions for an alert hooked off of
the IP address so that one could immediately run netstat and nmap as well as
whois and traceroute. This functionality cuts down a lot of unnecessary,
time-consuming activity navigating through a shell when all that is needed is
routine inspection. The drawback of a web interface is the lack of flexibility
as a security tool. Functionality is limited by script calls that are
predetermined by the interface code. So the only feasible attack responses
through the web interface are simple script calls that need specific parameters
that are easily accessible. Everything else must be done by dropping into a
shell. But as an attack inspection and a simple response tool, Prewikka can
prove very useful to a security team. Also, overall system policy changes can
be enacted very easily through the Mithril policy view.
Future
Directions
Presently
we are finishing up work on creating a sensor patch so that the Bro IDS acts as
a Prelude sensor. It involves translating the Bro event notifications into
IDMEF and sending messages to the Prelude Manager. The motivation behind this
came from the fact that out security team uses Bro as its IDS and reacts to
email notifications when events are triggered. This will bring their detection
and response issues into the Prelude system for first inspection of possible
attacks. Our goal has been to centralize management as much as possible to
reduce inspection time without compromising present capabilities. The use of
Prelude and our correlation and policy tools should be an enhancement to the
current state and not a replacement. We also need to continue work on
increasing the effectiveness and reliability of cfEngine for response
scenarios. This will greatly determine
the necessary parameters for making the adaptive policies more fine-grained and
tunable. Forensic and analysis tools employed after a compromise need to be
addressed as well. Then there are a number of issues that depend upon scaling
up the actual testbed. We will need to implement the Mithril system on a
sizable, dedicated network so that we can benchmark the responsiveness and
isolate its inherent weaknesses. This will require the ability to perform
orchestrated attacks for real-world simulations. These tests will give us a reasonable
idea of how well we can detect many different types and scales of attacks. And
once the system is compromised, we need to determine how well Mithril reacts by
containing the damage, adapting to the new conditions and finally returning to
the normal state once everything has been resolved.
Acknowledgement
This
work was supported by the Office of Naval Research (ONR) grant N0001404-1-0562.
Any opinions, findings, and conclusions or recommendations expressed in this publication
are those of the authors and do not necessarily reflect the view of ONR.